


Illustrating the Zoning Ordinance
PAS Report 165
Historic PAS Report Series
Welcome to the American Planning Association's historical archive of PAS Reports from the 1950s and 1960s, offering glimpses into planning issues of yesteryear. Use the search above to find current APA content on planning topics and trends of today.
More From APA

Interested in Graphics? You might also like:
Digital Graphics in Staff Reports
This issue of Zoning Practice discusses the use of digital graphics in staff reports based on a survey of and interviews with local planners.

|
AMERICAN SOCIETY OF PLANNING OFFICIALS 1313 EAST 60TH STREET — CHICAGO 37 ILLINOIS |
|
| Information Report No. 165 | December 1962 |
Illustrating the Zoning Ordinance
Download original report (pdf)
Prepared by Jerome L. Kaufman
Of all the material the planner has a hand in preparing, the zoning ordinance is probably referred to and used by more people than any other. Owners want information on how the district regulations apply to their properties. Businessmen want to know what effect zoning will have, if any, on their potential investments. Attorneys must interpret the meanings of complex zoning provisions for their clients. Members of zoning appeals boards and local governing bodies must have a firm grasp of zoning principles, text provisions and administrative procedures to intelligently carry out their responsibilities. And planners, often the chief custodians of the ordinances, frequently are called upon to explain and interpret zoning provisions.
The zoning ordinance text, in addition to being the prime source of information on the most widely employed form of land use control, is an instrument of communication, requiring, though often lacking, a high degree of comprehensibility. To explain the ordinance, many communities prepare simplified information brochures that highlight its most important features. These brochures vary in style. Some use humor to illustrate the points made; others are sober and straightforward. Many contain a liberal sprinkling of photographs, diagrams and drawings. All are brief and nontechnical. The Appendix contains a list of selected zoning information brochures.
Although the information brochure has value, it only supplements the ordinance that ultimately must stand alone as a document. If a property owner, for example, has a question related to the zoning of his own lot, he consults the ordinance, not the information brochure, for clarification. If he is confused or stumped for an answer, the fault can probably be traced to the fact that the ordinance is difficult to use and to understand. How many persons have at some time felt bewildered and frustrated in the course of using a zoning ordinance, even though they may not have resorted to the extreme measures taken by the hapless soul shown in Figure 1?
Drafters of zoning ordinances, therefore, should pay careful attention to the form in which the ordinance is presented, constantly striving to make the document clear, intelligible and readable. By no means is this easy. Apart from the complexity of many traditional zoning concepts, the modern zoning ordinance is even more difficult to understand because its coverage is broader and its provisions are discussed more explicitly to avoid subsequent misinterpretation and misuse.
Figure 1

The Zoning Ordinance Is Normally a Clear Concise Document with Liberal Cross References, and with Some of the Amendments Pasted In.*
In recent years, several techniques have been developed to make the zoning ordinance more readable. Statements of intent are inserted to clarify the purposes of the ordinance. An index of uses is usually included to provide the reader with a handy reference to the sections in which each is discussed. Summary charts are included which list major requirements — lot area, bulk, yards, frontage, parking, and similar specifications — for each zoning district. Good layout is achieved by avoiding cluttered pages, using more blank space and larger type, printing important headings in bold face type to make them stand out, using subheads, and making lines short enough to be taken in at a glance.
Noticeably absent in most zoning ordinances, though, are illustrations and diagrams. Of more than 500 recent zoning ordinances in the ASPO files, less than ten per cent contained any kind of illustrative material. Yet many zoning terms and provisions could be greatly clarified with the aid of illustrations in the ordinance document. This report, therefore, has a simple point to make: use graphic material in the zoning ordinance to illustrate, explain and clarify.
Why Few Illustrations?
Diagrams and illustrations may serve several purposes in a zoning ordinance: (a) they clarify zoning terms and provisions; (b) they provide a handy reference to major features of the ordinance; and (c) they increase the readability of the ordinance.
Zoning ordinance provisions easily lend themselves to graphic expression. The use of land and of the buildings, structures and objects occupying it are being regulated. These are concrete things, easy to visualize in either two or three dimensions. Diagrams serve to illuminate the important relationships between the physical objects discussed in the zoning ordinance, such as distances between structures and streets, between principal and accessory buildings, and between signs and buildings. If the benefits of illustrating the text are so obvious, why then are illustrations and diagrams so uncommon in zoning ordinances?
Perhaps the most important reason is the cost and time involved in preparing them. Usually, zoning ordinances are printed in large quantities, often at the lowest possible cost. It obviously costs more money and takes more time to prepare accompanying diagrams and drawings, especially if they are to be integrated with the text. Because sections of the zoning ordinance are sometimes amended, the community may be reluctant to prepare graphic material which may also have to be discarded. Many communities therefore decide that the cost of diagrams to illustrate parts of the text outweighs the benefits gained from having a zoning document which is easier to read and to understand.
Another explanation stems from the traditional failure of the technician to understand that his comprehension of technical concepts is much greater than that of the layman. The technician, because he frequently uses terms like floor area ratio, nonconforming use and transitional zoning, sometimes assumes that the layman is equally familiar with these and other zoning terms. Therefore, in preparing the ordinance for public distribution, the technician should use graphic material freely to clarify zoning terminology.
It is also possible that ordinance drafters shy away from using illustrations because they fear possible misinterpretation of the ordinance by the courts. Diagrams are usually examples of the way zoning provisions work; they show the application of provisions in typical situations. When a typical situation arises, the diagram could conceivably create uncertainty about the intent of the ordinance. To avoid this problem, some communities attach a simple disclaimer, indicating that the diagrams are only examples, and not actually parts of the ordinance.
Examples of Illustrations in the Ordinance
All sections of the zoning ordinance can benefit from graphic treatment. In The Text of a Model Zoning Ordinance, Bair and Bartley urge that diagrams be used in the definitions section:
It is well to remember that a diagram sometimes tells more than many words. Diagrams are valid legal instruments of definition and cities will be well advised to utilize them as part of the definitions section of the ordinance.2
There are numerous possibilities for using illustrations to good advantage in the district regulations section of the zoning ordinance. Quite often, the ordinance contains lengthy, involved passages describing how particular uses — parking facilities, accessory uses, signs — should be handled in a particular zoning district. An appropriate diagram or illustration can aid considerably in clarifying the text provisions. Complicated methods for dealing with special situations, such as computing the setback of a new building in a developed residential block, sometimes are difficult to understand without accompanying illustrative diagrams. Another use of graphics is to show with a single illustration how the major requirements for a particular zoning district — setback, height, yard, parking, lot area — apply to a typical structure. The ordinance user will then have a better idea of the distinguishing characteristics of each zoning district.
Even the section on administration and amendments could benefit from some graphic treatment. Flow charts, similar to those commonly used in subdivision ordinances to illustrate the plat approval procedure, could help explain the steps involved in obtaining a variance or a special permit, or in amending the ordinance.
In the following discussion, a number of diagrams and illustrations taken from adopted and proposed zoning ordinances are shown. By no means are these the only ones that can be included in the ordinance. They are presented here as examples of how illustrations have actually been employed to improve understanding of zoning ordinances.
Clarifying Definitions
Many zoning provisions are difficult to understand, either because the terms defined are unfamiliar or because they are defined in a special and detailed way.3 No matter how exact and accurate definitions are, certain terms may still require further clarification.
Take for example, the definition for sky exposure plane in the Baltimore, Maryland, proposed zoning ordinance:
An imaginary plane beginning at a lot line or directly above a street line at a height set forth in the district regulations, and rising over a slope determined by an acute angle measured down from the vertical as set forth in the district regulations.4
The definition has two characteristics. It deals with a concept few people have ever heard of before, and it defies understanding on first reading. Yet it does provide an accurate description of the term; the fault is that the words fail to convey clearly the meaning. Aware of this, the ordinance drafters inserted a simple diagram (Figure 2) in the ordinance to clarify the new concept. Thus the term sky exposure plane, when read in conjunction with the diagram, loses its mystery and becomes reasonably clear.
Figure 2
Illustration of Sky Exposure Plane

h is the height of the sky exposure plane (this height equals h1, the maximum height within the initial setback distance)
s is the initial setback distance
a is the angle of slope of the sky exposure plane
(f) is the depth of the front yard
Even floor area ratio, a term technicians frequently employ, can benefit from graphic treatment in the zoning ordinance. To most laymen, the concept is new. Floor area ratio is defined in the Boston, Massachusetts, proposed zoning ordinance as "the ratio of gross floor area of a structure to the total area of the lot."5 Although the definition is concise, it gives no clue that optional building arrangements are permitted on the site with consequent flexibility in design. With the accompanying illustrations (Figure 3), however, these qualities are clearly expressed.
Figure 3
Ratio of Floor Area to Lot Area

There are other examples of terms defined in zoning ordinances which are both unfamiliar to the layman, and difficult to understand solely from the text discussion. A few of these definitions and their illustrations are shown in Figures 4, 5 and 6, taken from the proposed New York6 and New Haven7 zoning ordinances.
Figure 4

640. Site Area, Gross. The "gross site area" of any large-scale development shall include the net site area thereof, plus the area between the boundaries of all zoning lots located within that development and the center line of adjoining streets.
Figure 5

641. Site Area, Net. The "net site area" of any large-scale development shall (subject to the provisions of section 722) include the area of all zoning lots within that development.
Figure 6

Vertical Building Section: The two-dimensional figure or figures that result from the intersection of a vertical plane parallel to a side or rear lot line with a principal building or principal buildings.
The zoning ordinance also contains definitions of terms common in everyday speech, but which are used in a special, often unfamiliar way in the text of the ordinance. These words are easily misunderstood unless their special meaning is emphasized. Illustrations are useful to clarify such definitions and bring them to the attention of the ordinance user.
Two examples are the words "cellar" and "basement". The dictionary meaning of basement is "the floor in a building next below the principal floor." A cellar is defined as "a room or set of rooms below the surface of the ground, usually under a building." These definitions, however, are not explicit enough for zoning purposes. The Los Angeles County zoning ordinance makes a more exact distinction — one infrequently made in ordinary language:
basement: that portion of a building between floor and ceiling, which is partly below and partly above grade but so located that the vertical distance from grade to the floor below is less than the vertical distance from grade to ceiling.
cellar: that portion of a building between floor and ceiling which is wholly or partly below grade and so located that the vertical distance from grade to the floor below is equal to or greater than the vertical distance from grade to ceiling.8
Figure 7

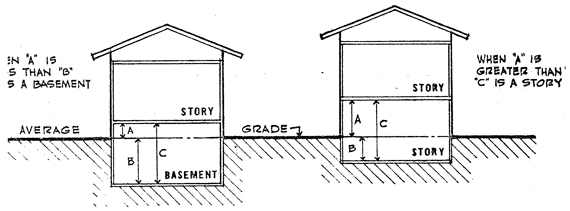
The terms are difficult to understand from the text, but the accompanying illustration (Figure 7) clearly shows the differences. It is interesting to note that a familiar term like basement can have different meanings in different ordinances. Figure 8 indicates that the St. Clair County, Michigan, Zoning Manual, which contains a model zoning ordinance, defines a basement9 exactly opposite to the way in which it is defined in the Los Angeles ordinance.
Figure 8
Basement & Story
Two other examples illustrating how graphics are used in zoning ordinances to clarify familiar words defined in detailed, special or unfamiliar ways are shown in Figures 9 and 10.
Figure 9
SECTION 144
PARCEL OF LAND

*SECTION 144. PARCEL OF LAND.
"Parcel of Land" means a contiguous quantity of land, in the possession of, or owned by, or recorded as the property of, the same claimant or person.
Figure 10
SECTION 137
GRADE

SECTION 137. GRADE.
"Grade" (ground level) is the average of the finished ground level at the center of all walls of a building. In case walls are parallel to and within five feet (5') of sidewalks, the above ground level shall be measured at the sidewalks.
Distinguishing Related Terms
Most zoning ordinances define several kinds of lots, yards, buildings, dwellings, setbacks, and signs. To the occasional user of the ordinance, the distinctions between a group of related terms may not be obvious from the text. Their real meanings may be easier to understand if their relationships to each other can be visualized. To clarify the distinctions between front, side and rear yards, for example, a composite diagram (Figure 11) is included in the St. Clair, Michigan, model zoning ordinance.10 In this way, the user has a single, handy visual reference to terms that are used throughout the ordinance for the three types of yards.
Figure 11
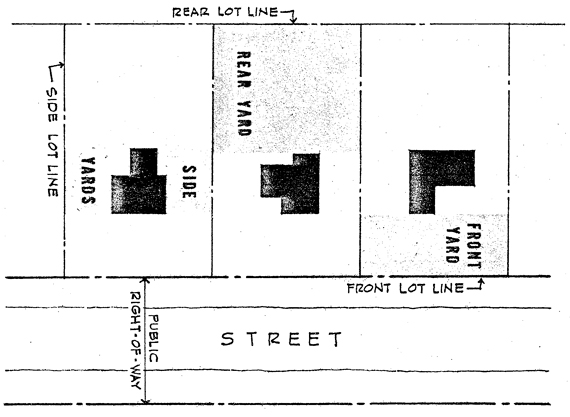
k. Yards: The open spaces on the same lot with a main building, unoccupied and unobstructed from the ground upward except as otherwise provided in this Ordinance, and as defined herein:
(1) Front Yard: Is an open space extending the full width of the lot, the depth of which is the minimum horizontal distance between the front lot line and the nearest line of the main building.
(2) Rear Yard: Is an open space extending the full width of the lot the depth of which is the minimum horizontal distance between the rear lot line and the nearest line of the main building.
(3) Side Yard: Is an open space between a main building and the side lot line, extending from the front yard to the rear yard, the width of which is the horizontal distance from the nearest point of the side lot line to the nearest point of the main building.
A good example of how diagrams can be used to clarify related terms is illustrated in the Cayce, South Carolina, zoning ordinance. Both lots and yards are defined in the text. Four types of lots — corner, interior, through, and reversed frontage — are defined and illustrated as shown in Figure 12. In an attempt to be explicit, the ordinance drafters define several kinds of yards and then show how these vary depending on the lot type in question. Although a front yard is ordinarily "a yard extending between side lot lines across the front of a lot,"11 it has a slightly different meaning for through and corner lots. Similarly, side and rear yards have different meanings. The two terms — yard and lot — and their variations are illustrated in one diagram (Figure 13). Note the similarity in layout between this diagram and the diagram for lot types shown in Figure 12.
Figure 12
Lot Types

400.20. Lot types
400.201. Corner lot: A lot located at the intersection of two or more streets. A lot abutting on a curved street or streets shall be considered a corner lot if straight lines drawn from the foremost point of the side lot lines to the foremost point of the lot (or an extension of the lot where it has been rounded by a street radius) at an interior angle of less than 135 degrees. See lots marked A(1) in lot types diagram.
400.202. Interior lot: A lot other than a corner lot with only one frontage on a street other than an alley. See lots marked B in lot types diagram.
400.203. Through lot: A lot other than a corner lot with frontage on more than one street other than an alley. Through lots with frontage on two streets may be referred to as double frontage lots. See lot marked C in lot types diagram.
400.204. Reversed frontage lot: A lot which is at right angles, or approximately right angles, to the general pattern in the area involved. A reversed frontage lot may also be a corner lot or an interior lot (A-D and B-D) in diagram, or even, in rare cases, a through lot (not illustrated).
Figure 13
Yards on Rectangular Lots

400.311. Front: A yard extending between side lot lines across the front of a lot . . .
In the case of through lots, unless the prevailing front yard pattern on adjoining lots indicates otherwise, front yards shall be provided on all frontages. Where one of the front yards that would normally be required on a through lot is not in keeping with the prevailing yard pattern, the administrative official may waive the requirement for the normal front yard and substitute therefore a special yard requirement which shall not exceed the average of the yards provided on adjacent lots.
In the case of corner lots which do not have reversed frontage, a front yard of the required pattern shall be provided in accordance with the prevailing yard pattern and a second front yard of half the depth required generally for front yards in the district shall be provided on the other frontage.
400.312. Side: A yard extending from the rear line of the required front yard to the rear lot line. In the case of through lots, side yards shall extend from the rear lines of the front yards required. In the case of corner lots, the yards remaining after full and half-depth front yards have been established shall be considered to be side yards.
400.313. Rear: A yard extending across the rear of the lot between inner side yard lines. In the case of through lots and corner lots, there will be no rear yard.
Figure 14

Two other examples showing differences between lot types in one diagram are depicted in Figures 14 and 15. In the Kern County, California,12 illustration (Figure 14), the lots are labeled by name rather than number, while the Des Moines, Iowa, ordinance13 shows the lots in perspective (Figure 15).
Figure 15

Other diagrams used to clarify related zoning definitions are found in the St. Clair County, Michigan, model zoning ordinance.14 Two kinds of distinctions are made. Figure 16 clarifies several terms related because they describe the parts of a structure. Figure 17 clarifies several terms related because they stem from the same generic term, in this case, dwellings.
Figure 16
Basic Structural Terms

Figure 17
Types of Dwellings

Summarizing Sections
The zoning ordinance is broad in scope, designating area, height, use, and density requirements for all parts of the community, as well as providing provisions for administering the zoning program. Because it is so comprehensive, summary statements and diagrams help to make the ordinance more useable and readable. A schedule of district regulations, listing the major requirements for each zoning district, is an excellent technique. A number of communities also use diagrams to summarize major sections of the zoning ordinance, thus providing a handy guide to lengthy and sometimes widely scattered portions of the ordinance.
One technique is to include a diagram immediately preceding the text for a particular zoning district. This illustration would show how the major requirements and provisions in that section apply to a typical structure and would emphasize the particular, distinctive characteristics of the zone.
Figure 18 illustrates an approach in which a three dimensional effect is created. The Portland, Oregon, ordinance15 has a summary diagram preceding the text provisions of each zoning district section. Another variation is found in the proposed zoning ordinance for New Haven.16 A site in perspective is shown in Figure 19, while the major requirements for a typical structure in the district are shown in the site plan, Figure 20. When using this presentation technique, it is important to specify clearly that the diagram is for illustrative purposes only. Otherwise misinterpretation of the diagram is possible by the ordinance user.
Figure 18
RIO One-family Residential

Figure 19
High-Middle Density

The two illustrations show typical construction in this district, both in perspective (above) and in plan (below). Property lines are indicated by heavy lines interrupted with dots, and required yards are indicated by dashed lines. The numbers on the plan refer to the various restrictions on size and placement of structures.
Figure 20

1. Minimum front yards: 17 feet.
2. Minimum rear yards: 25 feet.
3. Minimum side yards: one 8 feet and one 10 feet.
(In the case of corner lots, at least 8 feet for the one side yard.)
Size of side yard is also related to height of building walls (see text of each district).
4. Minimum average lot width: 50 feet.
5. Accessory buildings may extend into side and rear yards (see General Provisions for Residence Districts).
6. Corner visibility must be maintained (see General Provisions for Residence Districts).
OTHER REQUIREMENTS
Minimum lot area: 5,400 square feet.
Minimum lot area per dwelling unit: 2,000 square feet; 1,400 square feet per efficiency unit.
Maximum building coverage (all buildings): 30% of lot area.
Maximum building height: 4 stories or an average height of 45 feet.
Minimum parking: one parking space per dwelling unit, located either on the same lot or within 300 feet walking distance.
NOTE: These pages are for illustration only. For greater detail, and for non-residential construction, refer to text of each district and to the General Provisions for Residence Districts.
The New Haven ordinance contains another kind of summary diagram illustrating how accessory buildings are treated in the ordinance. This diagram, Figure 21, pulls together all the provisions pertaining to a general use found in many of the districts, thereby giving the reader a picture of how the use is regulated. Other general uses that could be diagrammed are, for example, signs and parking. The sketch shown in Figure 22 summarizes the regulations for signs in three zoning districts in the Grand Junction, Colorado, ordinance.17 The diagram precedes the section of the ordinance dealing with sign regulations.
Figure 21

Figure 22
Signs

In Figure 23, the illustration summarizes the maximum height regulations for each district. As with the other illustrations shown in this part of the report, the purpose of this diagram is to make it easier to use the ordinance by assembling at one point related provisions found throughout the text.
Figure 23

Clarifying Specific Provisions
Zoning ordinances occasionally specify elaborate methods to handle special situations that occur infrequently. Often the text is hard to follow and the use of a clarifying illustration helps considerably.
A good example is the explanation of how to determine the setback for a new building in a developed block in which existing building setbacks vary. Whatever method is used to determine the proper setback, it usually can be clarified with the aid of an appropriate diagram. The Des Moines, Iowa, zoning ordinance text discussing this procedure reads:
In any "R" district there shall be a minimum front yard required as stated in the yard requirements for that particular district; provided, however, that where lots comprising 30 per cent or more of the frontage within 200 feet of either side lot line are developed with buildings at a greater setback, the front yard setback shall be the average of these building setbacks and the minimum setbacks required for the undeveloped lots. In computing the average setback, buildings located on reverse corner lots — or entirely on the rear half of lots shall not be counted. The required setback as computed herein need not exceed 50 feet in any case.18
The simple diagram in the Des Moines ordinance shown in Figure 24 helps make sense out of the text. Although the text explaining the procedure for computing setbacks is different in the Boston, Massachusetts, zoning ordinance,19 its accompanying diagram (Figure 25) also serves a useful purpose.
Figure 24
Method of Computing Building Setback in a Developed Block
(See Section 2A-7, front yard)

Figure 25

Section 18-2. Exceptions for Existing Alignment. If the alignment of two or more existing buildings on each side of a lot within a distance of 150 feet and fronting on the same side of the same street between the nearest two intersecting streets is nearer to or farther from the street than required front yard depth, the average of such existing alignment within that distance shall be the required front yard line.
Other examples of diagrams used in zoning ordinances to clarify complicated procedures dealing with special zoning situations are shown in Figures 26 to 28. In each case, the methods are easier to understand if the text is supplemented by a diagram. Sometimes drafters of zoning ordinances use illustrations to clarify how particular uses are regulated by the ordinance. In some instances, the use may be allowed in almost every zoning district. An example is the diagram from the Sacramento zoning ordinance20 which illustrates one of several possibilities for arranging off-street parking areas (Figure 29). Another example is the sketch from the Grand Junction, Colorado, ordinance21 showing how fences are regulated in R-districts (Figure 30).
Figure 26

A. Yard requirements:
1. Front yards: Same as in section 32-43, with the following exceptions:
a. Where a corner lot in a Business or Industrial District directly abuts a lot in a Residence District along the same side of a street, all of the regulations of such Residence District for front yards shall apply to such corner lot along the street whose frontage it shares with such Residence District.
Figure 27

Section 18-3. Traffic Visibility across Corners. In any district where a front yard is required, no structure, fence, or planting shall be maintained within 30 feet of any corner street lot line intersection and within the required front yard, above a height of 3 feet above curb level or so as to interfere with traffic visibility across the corner.
Illustration (not part of regulations) of Section 18-3.
Figure 28

Building Height: Is the vertical distance measured from the established grade to the highest point of the roof surface for flat roofs; to the deck line of mansard roofs; and to the average height between eaves and ridge for gable, hip, and gambrel roofs. . . .
Figure 29

b. 60 DEGREE ANGLE PARKING — Each parking space shall be not less than eight (8) feet wide perpendicular to the parking angle nor less than eighteen (18) feet in length; measured at right angles to the building, curb or bumper line. Maneuvering space shall be not less than eighteen (18) feet in width perpendicular to the building or parking line. Total minimum width of parking area — 36 feet.
Figure 30
Fences or Walls in Building Area

In other instances, the use may be a special one, permitted only in a few districts. Bungalow courts, court apartments and group housing are permitted in the R-3 Zone in Sacramento, California,22 subject to special requirements. The special requirements are illustrated in the zoning ordinance (Figure 31).
Figure 31
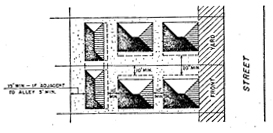
4. Special requirements for bungalow courts, court apartments, group and row dwellings:
a. For such uses located along one (1) side of a court or place, the minimum width of said court or place shall be ten (10) feet.
b. For such uses located on two (2) sides of a court or place, the minimum width of said court or place shall be twenty (20) feet.
c. The distance between main buildings and between main buildings and accessory buildings shall be not less than ten (10) feet.
d. Where a court or place is provided as required in this section, dwelling units may be erected to the rear of a bungalow court, court apartment, group or row dwelling over a detached accessory building provided the entire building is located not less than five (5) feet from any alley line or if there is no alley to the rear, the regular rear yard requirement for said lot shall apply.
Some Considerations
In drafting illustrations and diagrams for the zoning ordinance, several points should be considered.
1. Avoid using too many illustrations. An excessive number of diagrams and illustrations in the ordinance can detract from the most important part, the zoning text. The reader, distracted by the graphics, may skim over important passages. As a rule, diagrams should be used if they can aid in clarifying or explaining zoning provisions, or if they make the ordinance easier to read. The ordinance drafter should avoid illustrating provisions that are clearly understandable in the text. For example, the text of one zoning ordinance reads: "Fifty (50%) percent of the area of any lot is the maximum which may be covered by all buildings and/or structures located thereon."23 The diagram accompanying the text is merely window dressing. In a zoning ordinance which already contains numerous illustrations, it serves no real purpose and may even be distracting.
2. Avoid the use of illustrations that confuse or mislead. Occasionally, a diagram may confuse the reader and raise questions of interpretation, rather than clarify the text. Figure 32 shows an illustration from a zoning ordinance which purports to explain the lot coverage provisions for a commercial zone. The text reads: "No building or structure or group of buildings with their accessory buildings shall cover more than sixty (60) percent of the area of the lot."24 By showing the unshaded part of the diagram as a parking area, the ordinance unintentionally throws the reader off the track. He may conclude that parking must occupy that portion of the site not covered by a building. But part of this area could be landscaped or perhaps even left vacant. In this case, the diagram misleads.
Figure 32
Lot Coverage for Commercial Zones

8-28-7 Coverage Regulations.
No building or structure or group of buildings with their accessory buildings shall cover more than sixty (60) percent of the area of the lot.
Another example is the diagram (Figure 33) illustrating how to define lot area. It is questionable whether the diagram clarifies the definition of this term.
Figure 33

LOT AREA: The total horizontal area of a lot lying within the lot lines and excluding any area lying beyond a street line.
When considering using an illustration for the zoning ordinance, special care should be given to make sure that the illustration enlightens rather than confuses.
3. Use graphics to improve the appearance of the ordinance. Sometimes, illustrations can be used in an ordinance even if they do not clarify or explain specific provisions of the ordinance. The Richmond, California, zoning ordinance,25 for example, contains a number of sketches showing typical block frontages for each zoning district. Each sketch serves as a general introduction to the text of a zoning district. These illustrations (Figure 34) were included in the ordinance primarily to improve its general appearance, not to help explain a particular provision or definition. They suggest interesting possibilities for using graphics in a freer manner to make the zoning ordinance a more handsome and attractive document.
Figure 34

4. Intersperse diagrams with text. The illustration should be placed beside or close to the text it relates to, preferably on the same page. In this way the user can easily check the diagram without having to thumb through the whole ordinance to find the appropriate illustration.
5. If illustrations are placed in a separate section, cite the page number where each can be found directly after the zoning provision it clarifies. In some zoning ordinances all diagrams are placed in a separate section or appendix, perhaps because the staff prefers to dodge the layout problem or to avoid the expense involved in integrating illustrations with text. Unfortunately, a few of these ordinances do not list page numbers where the appropriate diagrams can be found. In such ordinances they are virtually useless. The diagram's page number should be placed directly after the text it refers to, giving the location of the diagram in the ordinance — e.g., see page x for illustration of this provision.
6. If applicable, specify that illustrations are not part of the ordinance. Several zoning ordinances show typical examples of provisions in diagram form but do not clearly specify that the diagrams are only for illustrative purposes. In such cases, the illustration may be considered a part of the adopted ordinance. While a schedule of district regulations is frequently adopted as part of the ordinance, illustrations seldom are. To avoid possible misinterpretation of graphic material, statements such as the following can be inserted at the beginning of the ordinance:
The illustrations in the publication are not a part of the ordinance, but are included herein for purposes of explanation and clarification only.
Illustrations shown in text are illustrative only and do not constitute a portion of this ordinance.
Or, the disclaimer can be attached to the specific illustration — e. g., for information only, not part of code — if other diagrams are intended to be part of the ordinance.
Appendix
Zoning Information Brochures
Atlanta, Georgia, Planning Department. The Atlanta Zoning Ordinance and You. 1960.
Berkeley, California, Planning Department. Should Berkeley's Neighborhoods be Rezoned? 1962.
Charleston County, South Carolina, Planning Board. Zoning: What is It? What Can It Do? 1957.
Chicago, Illinois, City Council Committee on Building and Zoning. Zoning and How It Affects You. 1956.
Clarkstown, New York, Zoning Advisory Committee. Your Future Plans in Clarkstown. 1954.
Colorado Springs, Colorado, City Planning Commission. Why a New Zoning Ordinance? 1950.
Cook County, Illinois, Zoning Committee. A Comprehensive Plan for Rezoning Cook County. 1957.
Delaware County, Pennsylvania, Housing Advisory Committee. Zoning for Better Living. 1950.
Huntington, West Virginia, Planning Commission. Zoning Makes the Difference. 1958.
Kansas City, Missouri, Plan Commission. What Zoning Means to You. 1954.
Los Angeles County, California, Regional Planning Commission. Zoning and You. 1948.
Louisville and Jefferson County, Kentucky, Planning and Zoning Commission. Forty Questions and Answers about Planning and Zoning. 1949.
Minneapolis, Minnesota, Planning Commission. You and Modern Zoning. 1960.
New Haven, Connecticut, Planning Commission. Guide to New Haven Rezoning. 1962.
Philadelphia, Pennsylvania, Citizens Council on City Planning. A New Zoning Ordinance for Philadelphia. 1961.
Saginaw, Michigan, Planning Department. Zoning in Saginaw. 1955.
St. Petersburg, Florida, Planning Department. Where Am I in the New Zoning Ordinance? 1959.
San Antonio, Texas, Planning Commission. Recommended Planning Standards for Zoning Purposes. 1956.
References
1. The following ASPO Planning Advisory Service reports will be helpful: Information Report No. 92, Statements of Purpose and Intent in Zoning Ordinances (November 1956); Information Report No. 127, Zoning Ordinance Indexing (October 1959); and Information Report No. 99, Towards More Readable Zoning Ordinances (June 1957).
2. Fred H. Bair, Jr. and Ernest R. Bartley, The Text of a Model Zoning Ordinance (Chicago: American Society of Planning Officials, 2d ed. 1960), p. 79.
3. For a discussion of zoning definitions, see ASPO Planning Advisory Service Information Report No. 72, Zoning Ordinance Definitions (March 1955).
4. A New Zoning Ordinance for Baltimore: Preliminary Recommendations (Baltimore: Zoning Commission of Baltimore City, 1962), p. 5.
5. Proposed Zoning (Boston: City Planning Board, 1958), Introduction p. 3.
6. Harrison, Ballard & Allen, Plan for Rezoning the City of New York (New York: City Planning Commission, 1950).
7. Rezoning for New Haven, Connecticut: Proposals for Comprehensive Amendment of the Zoning Ordinance (New Haven: City Plan Commission, 1962).
8. Los Angeles County Zoning Ordinance (Ordinance No. 1494) (Los Angeles: Los Angeles County Regional Planning Commission, 1958), p. 3.
9. Zoning Manual for the Port Huron-St. Clair County (Michigan) Metropolitan Region (Port Huron: The St. Clair Regional Planning Commission, 1962), Appendix p. 3.
10. Ibid.
11. Proposed Zoning Ordinance (Cayce, South Carolina: City Planning Commission, 1961), p. 53.
12. Official Land Use Zoning Ordinance (Ordinance No. G-299) (Kern County, California: County Board of Supervisors, 1957).
13. Zoning Ordinance (Ordinance No. 5453) (Des Moines, Iowa: City Plan and Zoning Commission, 1953).
14. Zoning Manual, op. cit.
15. Planning and Zoning Code of the City of Portland, Oregon (Ordinance No. 110103) (Portland: City Council, 1959).
16. Rezoning, op. cit.
17. City Zoning Ordinance (Ordinance No. 1158) (Grand Junction, Colorado: City Planning Commission, 1961).
18. Zoning Ordinance, op. cit., p. 15.
19. Proposed Zoning (Boston), op. cit., p. 36.
20. Comprehensive Zoning Ordinance (Ordinance No. 1963, Fourth Series) (Sacramento, California: City Council, 1956).
21. City, op. cit.
22. Comprehensive, op. cit., p. 10.
23. Ibid., p. 8.
24. Uniform Zoning Ordinance of Salt Lake County, Utah, As Amended (Salt Lake City: County Planning Commission, 1957), p. 80.
25. Zoning Ordinance (Ordinance No. 1291, as amended) (Richmond, California: City Planning Commission, 1949).
Illustration Credits*
1. Hedman, Richard, and Fred Bair, Jr. And on the Eighth Day. . . Philadelphia: Falcon Press, 1961.
2. Reference 4, p. 5.
3. Reference 5, Introduction p. 4.
4. Reference 6, p. 188.
5. Reference 6, p. 188.
6. Reference 7, Part 2, p. 71.
7. Reference 8, Illustrations p. 1.
8. Reference 9, preceding Appendix p. 4.
9. Reference 8, p. 5 and Illustrations p. 3.
10. Reference 8, p. 4 and Illustrations p. 2.
11. Reference 9, Appendix pp. 6 and 7, and preceding Appendix p. 7.
12. Reference 11, p. 50.
13. Reference 11, pp. 53-54.
14. Reference 12, p. 3.
15. Reference 13, p. 10.
16. Reference 9, following Appendix p. 3.
17. Reference 9, following Appendix p. 8.
18. Reference 15, preceding Article 10.
19. Reference 7, Part 2, following p. 39.
20. Reference 7, Part 2, preceding p. 40.
21. Reference 7, Part 2, p. 64.
22. Reference 7, preceding p. 32.
23. Reference 12, p. 23.
24. Reference 13, p. 15.
25. Reference 5, p. 36.
26. Reference 7, Part 2, p. 116.
27. Reference 5, p. 36.
28. Reference 9, Appendix p. 3 and preceding Appendix p. 4.
29. Reference 20, p. 21.
30. Reference 17, following p. 39.
31. Reference 20, p. 10.
32. Reference 24, p. 80.
33. Reference 7, Part 2, p. 7.
34. Reference 25, pp. 5-1, 9-1 and 10-1.
Acknowledgment
Special thanks are due Thomas Serb, ASPO Editorial Associate, for his work in laying out the material and illustrations in this report.
Copyright, American Society of Planning Officials, 1962.