Jan. 23, 2023
This story is part of the "Tech Tools" series, created in collaboration with APA's Technology Division. From climate resilience to mobility to regional planning, we highlight topical datasets, applications, and other tools that help planners understand — and better plan for — their communities.
Planning resilient communities globally
How we plan resilient communities is a global challenge. Development is continuing in high-risk areas around the globe, and climate change looms as a risk multiplier with wide downstream effects on communities. By 2050, one in three Americans will be exposed to extreme conditions (compared to the historical baseline of one in six), according to FEMA's 2021 National Preparedness Report. (The 2022 report was released in December.)
Planners will need an understanding of important climate data and technology tools to help communities prepare for future and present threats to people and assets, and to understand how disproportionately vulnerable communities will be impacted.
This article is the first in the new "Tech Tools" series. It explores a handful of recent climate change and resilience datasets and tools, curated for you by members of APA's Technology Division.

National Risk Index
National Risk Index
Visualizer | Application | Data
In 2021, FEMA released the National Risk Index as an online mapping application and dataset that identifies communities most at risk to 18 different natural hazards, which were identified in a comprehensive review of FEMA approved hazard mitigation plans. The index is based on the combination of three independently useful metrics that measure the ability to bounce back, considering social vulnerability, community resilience, and more. It summarizes risk scores at the county and census tract level, and can be printed or exported for use in GIS software. Planners and others can use it to assess local and regional risk, support hazard planning, and understand the magnitude of costs that different hazards might impose on communities.
Cost: Free
Resource formats: Geospatial, summary reports
Coding skills required: No

Climate Mapping for Resilience & Adaptation
Climate Mapping for Resilience & Adaptation
Visualizer | Application | Data
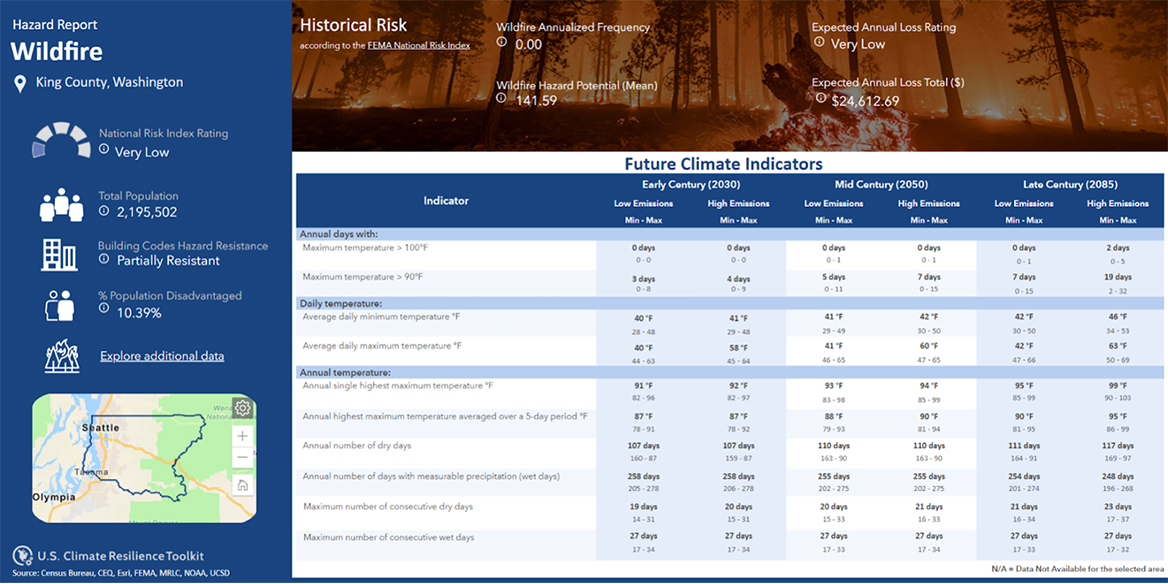
This climate adaptation mapping tool integrates multiple datasets such as the National Risk Index, downscaled climate model data, and other federal government resources. Climate Mapping for Resilience & Adaptation provides access to data and reporting, at county and census tract level, on past, present, and future climate conditions. This data also identifies how communities' exposure to extreme heat, drought, wildfire, flooding, and coastal inundation may change given different climate scenarios consistent with the Fourth National Climate Assessment. The tool also helps connect planners and other users with federal grant funds to support equitable climate resilience.
Cost: Free
Resource formats: Geospatial, summary reports
Coding skills required: No

Risk Factor
Risk Factor
Visualizer | Application | Data
First Street Foundation's browser-based Risk Factor tool offers a solution to the issue of asset-level risk assessment for homeowners and commercial real estate professionals. The climate risk factor data is available for download at the census tract level free of charge, but other services and detailed reports may incur a fee (ULI members can access up to five reports free of cost). Users can search for their address, zip code, city, or county and receive a detailed report of conditions for three factors — flood, fire, and heat — after filling out a form about the data's intended use. The purpose of this raw data is to "help provide insights into current and future risk, accelerate climate assessments, and help with planning for flood, wildfire, and extreme heat adaptation and mitigation efforts."
Cost: Paid (census tract estimates free)
Resource formats: Summary reports, geospatial
Coding skills required: No

Adaptation Clearinghouse
Adaptation Clearinghouse
Resource Aggregator
The Georgetown Climate Center's Adaptation Clearinghouse database aggregates climate change adaptation measures implemented by communities. It offers scholarship, solutions, and real U.S. case studies for the myriad considerations associated with climate adaptation and mitigation. With resources encompassing a variety of sectors — namely coastal, ecosystems, energy, public health, transportation, and water — it enables communities to progress from assessment to implementation. The site's networking tools also help adaptation professionals and public officials connect and learn from each other. Coverage levels vary across resources.
Cost: Free
Resource formats: Literature compendium, social network
Coding skills required: No

Geosnap
Geosnap
Analysis Tool
Geosnap is a Python library that offers a range of analytical methods for examining the spatial and temporal aspects of neighborhoods. Users can create neighborhood clusters, calculate segregation indices, and align boundaries across time periods, as well as visualize these places as they change over time. Available for free at the census tract level and for a cost at the asset level, this tool can provide planners with insights into the characteristics of different neighborhoods and how they evolve, while also enabling users to evaluate different aspects of existing disparities and their intersection with climate risk or natural hazards.
Cost: Free (payment required at asset level)
Resource formats: Python package, geospatial
Coding skills required: Yes


