July 27, 2023
This story is part of the "Tech Tools" series, created in collaboration with APA's Technology Division. From climate resilience to mobility to extended reality tools, we highlight topical datasets, applications, and other tools that help planners understand — and better plan for — their communities. The authors thank the Transportation Planning Division's Justin Porter for his review of this article.
Data critical for equitable planning
As communities begin to address the imperative for transformative climate resilience and transportation policies that enhance safety and equity, harnessing pertinent data sources is absolutely critical. An infusion of new funding from the Bipartisan Infrastructure Bill and the Justice40 Initiative has laid the groundwork for a national focus on infrastructure investments that bolster underserved communities. Planners can use numerous publicly available datasets — like the U.S. Environmental Protection Agency's EJScreen — to inform local actions and justify equity-first investments. This data complements Justice40 or U.S. Department of Transportation's Disadvantaged Communities data.
Here are four more tools to help planners build a more comprehensive picture of needs, opportunities, and solutions to achieving greater equity in climate and transportation efforts.

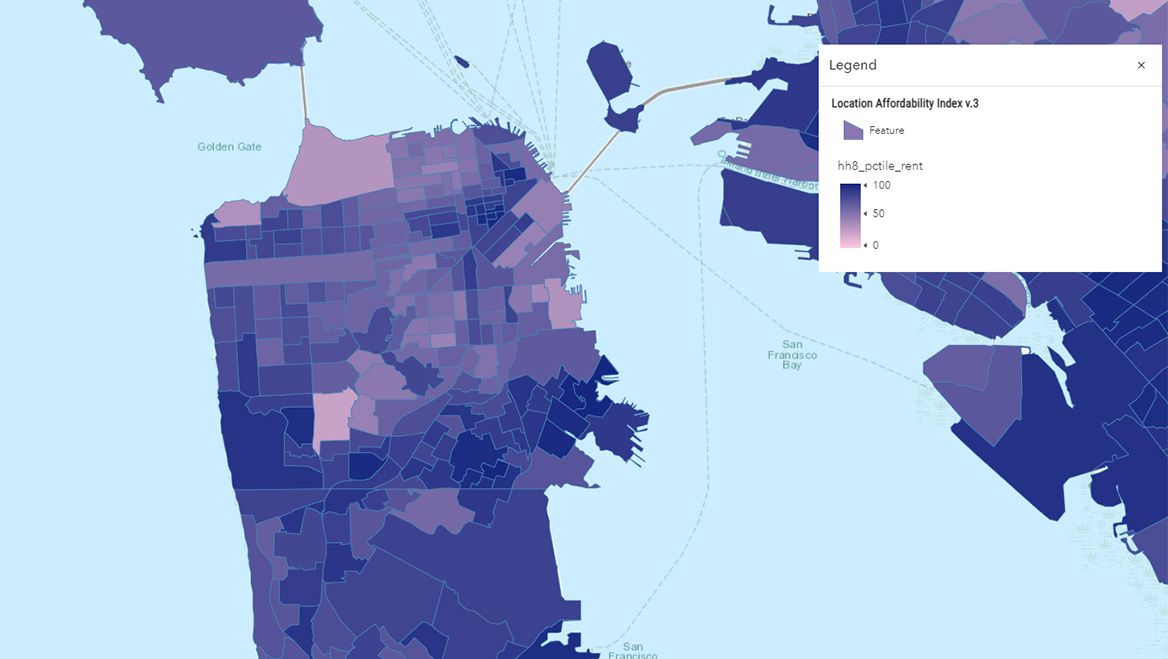
Image from Location Affordability Index.
Location Affordability Index
Data | Visualizer
The Location Affordability Index (LAI), developed collaboratively by the U.S. Department of Housing and Urban Development and the USDOT, provides estimated housing and transportation costs at the census tract level, alongside built environment and demographic data. A rich resource for urban planners, its methodology draws on an intricate web of interconnected independent and dependent variables to produce models that empower users to scrutinize the combined costs of housing and transportation for eight different types of households. Results can be organized by specific household makeup, showing the costs for median-income families, retired couples, single-parent households, and other groups. These cost profiles can aid planners in crafting narratives to help elected officials and the public understand the potential financial challenges that diverse, particularly socially vulnerable households may encounter relative to others in the same region and then develop informed policies and plans that support them.
Cost: Free
Resource formats: GIS
Coding skills required: No

Image from Opportunity Atlas.
Opportunity Atlas
Data | Visualizer
Public investments are often aimed at improving the neighborhoods and housing where children live in order to provide a path to upward mobility and positive outcomes into adulthood. HUD has studied this intensively, notably in its 1990s-era Moving to Opportunity Study and subsequent reports, which found that living in lower-poverty neighborhoods at very early ages has the greatest effect on higher socioeconomic status and earnings later in life. Now, the Opportunity Atlas makes these insights actionable for policy makers. It combines U.S. Census Bureau data with anonymized tax data to identify children's outcomes in identified neighborhoods, in some cases providing estimates of earnings distributions, incarceration rates, and other outcomes in adulthood based on the census tract where individuals grew up. The Opportunity Atlas provides easy options for GIS data downloads and an accessible dashboard that can be used to create quick image exports of maps.
Cost: Free
Resource formats: GIS, images
Coding skills required: No

Centers for Disease Control Social Vulnerability Index.
CDC Social Vulnerability Index
Data | Visualizer
A number of socioeconomic and infrastructure factors affect a community's resilience to both human-made and natural disasters. The Centers for Disease Control created the Social Vulnerability Index (SVI) to help planners and others identify communities most in need of support before, during, and after such events. Considering variables like housing type, socioeconomic status, race, English proficiency, age, and household vehicle availability, the composite SVI can help answer questions such as: Where might transportation challenges make compliance with an evacuation order difficult? Which communities might not understand English-only instructions to shelter in place? Data is available at the census tract level and users can also overlay point features such as day-care centers and nursing homes, which are indicators of vulnerable populations. Users can interact with the map online or download the spatial data.
Cost: Free
Resource formats: GIS
Coding skills required: No

Image from Access to Jobs and Workers Via Transit Tool.
Smart Location Mapping
Data | Visualizer
When low-wage workers can get to jobs on public transportation, it's good not only for workers, but also for employers. Enter the Access to Jobs and Workers via Transit tool, a publicly available source of data on the transit accessibility of people, workers, and jobs at the block group level. A sister tool to the Smart Location Database, it includes metrics related to spatial mismatch, such as the percentage of low-to-medium wage workers in the region who can reach each block group within a 45-minute transit and walking commute from their homes. This tool expands on and lends nuance to the usual jobs-worker mapping analysis, focusing on both workers' access to jobs and employers' access to workers. Users can interact with the map online or download shapefiles for their own analysis.
Cost: Free
Resource formats: GIS
Coding skills required: No


